
Introduction
Afterburner was designed to enhance Microsoft .NET Framework’s functionality in the least invasive way for the developer. Introducing any of the offered features into your application is largely seamless and, once introduced, they appear to be part of the original functionality of .NET framework. The generated code is injected directly into the assemblies comprising your solutions without either requiring you to make source code modifications or modifying the code for you. This design ensures that any .NET language you utilize is supported. The only actions required from you are choosing the assemblies to target and selecting the features to be injected into your targets. Different feature sets can be picked for release, debug, etc. builds of the chosen assemblies.
Features
Deadlock Detection
Deadlock Detection feature enhance the functionality of the framework’s System.Threading.Monitor class by adding a deadlock detection algorithm to the class’ Enter() and TryEnter() methods. Incidentally, the lock keyword of C# language is a syntactic construct translated by the compiler into a specific pattern based on the Monitor class hence the features apply to this keyword as well. If the algorithm determines that the thread executing Enter() or TryEnter() call would have completed a deadlock cycle by blocking in this call indefinitely, the algorithm throws a DeadlockException in the calling thread. The exception’s message describes the complete wait-for cycle between all involved threads as well as the objects acquired and waited on by these threads.
The additional processing done by the deadlock detection algorithm does not come for free. Some performance degradation is to be expected. However, for a typical application that does not do excessive lock acquisitions the performance penalty is reasonable. As an alternative to applying this feature on a regular basis you might consider engaging the feature only when necessary such as when you know your application is experiencing a deadlock that can be reproduced relatively easily.
Deadlock Prediction
Similar to the previous feature, Deadlock Prediction also enhances the functionality of the framework’s System.Threading.Monitor class by adding lock acquisition patterns analysis. More often than not a multithreaded application needs to manipulate in atomic fashion several data structures protected by different synchronization objects. The thread performing such a complex operation must have an exclusive access to all of the involved data structures at once to ensure atomicity of the operation. This implies that the thread must acquire all of the involved synchronization objects before it can proceed. Lock leveling algorithm is one of the most commonly used techniques to prevent deadlocks from happening between threads performing such complex operations. It dictates that each thread must acquire the necessary locks only in the designated order. Here is a good article covering this topic in details: Use Lock Hierarchies to Avoid Deadlock by Herb Sutter.
The more complex an application is, the more discipline is required from developers to properly adhere to the lock leveling strategy. Deadlock Prediction feature is designed to assist in identifying the strategy violations by monitoring what locks and in what order are acquired by each thread and reporting all instances of locks being acquired by different threads in a conflicting order. Such an ordering violation is a strong indicator that a potential for a deadlock exists in the application and it’s just a matter of time before your application executes a particular timing sequence of the execution steps to actually reach the deadlock state. This feature generates a report after the test application completes its execution. It contains the description of each thread that acquired some locks, the particular sequence of lock acquisitions for each of the involved threads and the stack or multiple stacks showing where each lock was acquired. Please see the Reports section below for the details.
It’s not necessary to apply Deadlock Prediction feature to a project at all times. In fact, additional actions that need to be performed during the application execution can slow the application down. There is also a potentially lengthy (depending on the complexity of the application) report generation step that follows the termination of the application. Due to this overhead the feature is intended to be employed periodically to check that the latest code modifications did not introduce new lock leveling violations. In this respect, the feature is somewhat similar to a performance analysis by a profiler tool – an infrequent operation and analysis that only needs to be performed at key stages of a development cycle.
Dispose Monitoring
Even though .NET offers garbage collection (GC) as one of its key facilities, the nondeterministic nature of the GC algorithms makes it less than perfect for controlling life times of objects managing critical resources that need to be released in a timely manner. For such situations .NET introduced IDisposable interface. Implementing this interface allows a class to “advertise” to its clients the fact that its instances control critical resources and therefore clients are encouraged to call an instance’s Dispose() method as soon as it is no longer needed so that it can release its resources even before it is garbage collected. Unfortunately, there is no facility that enforces this behavior – if a developer using such a class fails to call the Dispose() method in a timely manner the critical resources can stay tied up for an indefinite period of time. You can find a very detailed discussion of this and related topics in DG Update: Dispose, Finalization, and Resource Management article by Joe Duffy.
Dispose Monitoring feature is designed to report on all instances of classes implementing IDisposable interface whose Dispose() method was not called before the instance was garbage collected. Un-disposed objects are being listed in the report generated after the test application completes its execution. It contains the object’s description and the stack showing where the object was allocated. Please see the Reports section below for the details. Again, additional actions that need to be performed during the application execution can slow the application down. Therefore, this feature is intended to be used only occasionally after some substantial code modifications were made to verify that modified code still takes care of all disposable objects.
Installation
Make sure Visual Studio is not running when you execute the downloaded installation file. Otherwise, the installation is quite unremarkable and only presents the usual choice of options for the location of the installation files and whether the add-in is installed for every user of the system or only for the installer. Either way the Windows account running the installation does require administrative rights.
User Interface
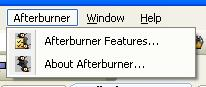
Upon successful installation of the add-in and starting of Visual Studio you will find a new entry on the main menu titled “Afterburner”
as well as an additional entry in the Project menu called “Afterburner Features…”
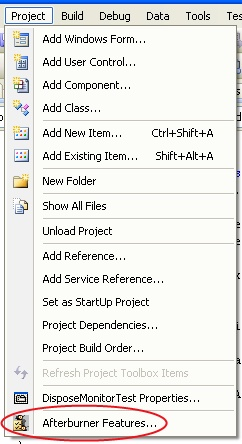
The “About Afterburner…” is self explanatory. The “Afterburner Features…” entry only appears when a solution is opened with at least one .NET project in it. This entry invokes the following dialog
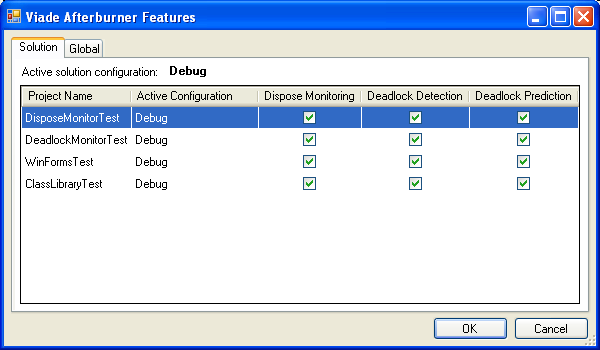
where you can choose to apply any of the supported features to any of the .NET projects in your solution. The features are applied to the currently active project configuration (stated in the second column) for the corresponding project. In order to apply the features to a different project configuration you must switch the corresponding active solution configuration in Visual Studio Standard toolbar or through Build|Configuration Manager Dialog. “Afterburner Features…” dialog also has a tab named “Global”. This tab contains settings that apply to any solutions/projects for the current Windows user.
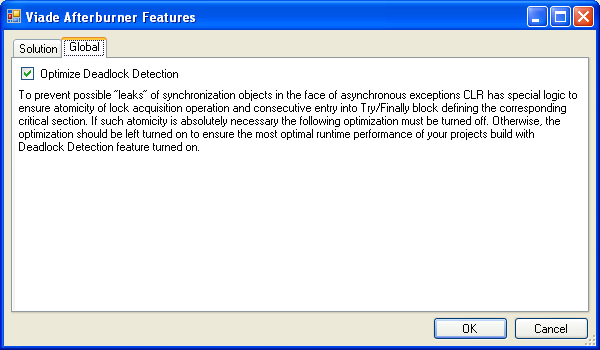
Currently there is only one setting – “Optimize Deadlock Detection” which is turned on by default. This optimization reduces the performance degradation imposed by the Deadlock Detection feature but at the cost of relaxing one of the “correctness” constraints in CLR, namely that the Monitor.Enter() must be immediately followed by the try/finally block. You can read Monitor.Enter(), thread aborts, and orphaned locks article by Joe Duffy to get more details on this topic.
There is a very particular set of circumstances when you would want this setting to be turned off: you chose to use the Deadlock Detection feature for your release build and your application is specifically “hardened” against asynchronous CLR exceptions (out of memory, stack overflows and thread aborts). If you are not sure what asynchronous exceptions are and/or you are not using constrained execution regions (CER) in your code, chances are you should keep this optimization turned on. Here is an article that discusses this topic: Constrained Execution Regions.
The choice of features applied to a particular build configuration for any project is stored directly in the corresponding project file and therefore the chosen features are applied whenever any user builds this project. Also, a reference to Viade.Afterburner.Runtime.dll assembly is being injected into the projects automatically. Upon successful build of a project, Afterburner initiates its post-processing step where the features are applied. The following messages can be seen in the Output window:
========== Afterburner started ==========
========== Afterburner postprocessing: DisposeMonitorTest ==========
========== Afterburner postprocessing: DeadlockMonitorTest ==========
========== Afterburner postprocessing: WinFormsTest ==========
========== Afterburner postprocessing: ClassLibraryTest ==========
========== Afterburner completed ==========
Once the Afterburner step is over, the output assemblies have been generated with the selected features. Just like you can cancel the regular build process while it is still in progress using Cancel command on Build menu, you can use this command to cancel the Afterburner step. If the assemblies are built with debug information the Afterburner post-processing does not disturb it in any way. The only effect that you might notice is some extra stack frames on top of your code without corresponding source code (analogous to the frames of the framework itself). You can safely ignore those – they are implementation detail that can change in future releases. The reference to Viade.Afterburner.Runtime.dll assembly is automatically removed once all of the features are disabled for the project.
Reports
The Afterburner features are based on dynamic analysis of the running application. The likelihood of discovering bugs using any of the features is very much dependant on the code coverage of the particular test runs executed while the features are enabled. Basically, a choice of test scenarios largely determines the effectiveness of testing.
As stated earlier Deadlock Detection feature does not generate a report per se but rather throws an exception immediately upon discovering a deadlock in the thread that completed the deadlock cycle. The exception’s message describes the complete wait-for cycle between all involved threads as well as the objects acquired and waited on by these threads. Here is an example of a typical message in the DeadlockException:
Thread 13(Thread C) completed a deadlock cycle by waiting
   at DeadlockMonitorTest.Program.ThreadMethodUsingLock() in C:\DeadlockMonitorTest\Program.cs:line 297
   at System.Threading.ThreadHelper.ThreadStart_Context(Object state)
   at System.Threading.ExecutionContext.Run(ExecutionContext executionContext, ContextCallback callback, Object state)
   at System.Threading.ThreadHelper.ThreadStart()
for critical section DeadlockMonitorTest.DeadlockMonitorTest+CustomLockObject=0x1400C58(Lock 1) which was acquired
   at DeadlockMonitorTest.Program.ThreadMethodUsingLock() in C:\DeadlockMonitorTest\Program.cs:line 294
   at System.Threading.ThreadHelper.ThreadStart_Context(Object state)
   at System.Threading.ExecutionContext.Run(ExecutionContext executionContext, ContextCallback callback, Object state)
   at System.Threading.ThreadHelper.ThreadStart()
by Thread 12(Thread B) which, in turn, waits
   at DeadlockMonitorTest.Program.ThreadMethodUsingLock() in C:\DeadlockMonitorTest\Program.cs:line 297
   at System.Threading.ThreadHelper.ThreadStart_Context(Object state)
   at System.Threading.ExecutionContext.Run(ExecutionContext executionContext, ContextCallback callback, Object state)
   at System.Threading.ThreadHelper.ThreadStart()
for critical section DeadlockMonitorTest.DeadlockMonitorTest+CustomLockObject=0x2428E43(Lock 2) which was acquired
   at DeadlockMonitorTest.Program.ThreadMethodUsingLock() in C:\DeadlockMonitorTest\Program.cs:line 294
   at System.Threading.ThreadHelper.ThreadStart_Context(Object state)
   at System.Threading.ExecutionContext.Run(ExecutionContext executionContext, ContextCallback callback, Object state)
   at System.Threading.ThreadHelper.ThreadStart()
by Thread 13(Thread C) which completes the cycle.
A thread is identified by its ManagedThreadId followed in parentheses by its Name if one was assigned. An object is identified by its type and hash code followed in parentheses by its ToString() representation if one exists. For these thread and object identifiers to be useful in recognizing which players are involved in the deadlock it helps to provide meaningful thread names and lock objects’ ToString() implementations.
While the test application is running, both Deadlock Prediction and Dispose Monitor features generate raw report data. The raw report data is stored in Afterburner subdirectory created under the directory where the executable of your test application resides. Upon application’s completion the raw data is being processed. The processing time depending on the number of threads and lock objects acquisitions in the application. A progress bar may be displayed while the data is being processed if the processing turns out to be a lengthy operation. The data processing step generates a report text file placed into the same Afterburner subdirectory after the raw data used to generate this report was deleted. Once report text file is created it is opened in Visual Studio for your examination. If the application was not executed from within the Visual Studio then the default text reader application is opened to display the report. The report file naming follows this pattern: <Feature_Name>_<date>_<time>.txt. Each run of the test application generates one report file per enabled feature.
The following is an example of a Deadlock Prediction feature report:
------ Afterburner Deadlock Prediction feature report for AppDomain=1[DeadlockMonitorTest.vshost.exe] start ------
Thread 11(Thread A) and Thread 12(Thread B) entered critical sections controlled by
    DeadlockMonitorTest.DeadlockMonitorTest+CustomLockObject=0xBB8560(Lock 88) and
    DeadlockMonitorTest.DeadlockMonitorTest+CustomLockObject=0x165F26B(Lock 69)
in a conflicting order.

Thread 11(Thread A) entered the critical sections in the following order:
    DeadlockMonitorTest.DeadlockMonitorTest+CustomLockObject=0x1E6FA8E(Lock 45) ->
    DeadlockMonitorTest.DeadlockMonitorTest+CustomLockObject=0x19FD5C7(Lock 46) ->
    DeadlockMonitorTest.DeadlockMonitorTest+CustomLockObject=0x2BF8098(Lock 22) ->
    DeadlockMonitorTest.DeadlockMonitorTest+CustomLockObject=0x2804C64(Lock 44) ->
    DeadlockMonitorTest.DeadlockMonitorTest+CustomLockObject=0x165F26B(Lock 69) ->
    DeadlockMonitorTest.DeadlockMonitorTest+CustomLockObject=0xBB8560(Lock 88)

Stack(s) at entering into critical section controlled by DeadlockMonitorTest.DeadlockMonitorTest+CustomLockObject=0xBB8560(Lock 88):
   at DeadlockMonitorTest.Program.ThreadMethodUsingRandomMonitors() in C:\DeadlockMonitorTest\Program.cs:line 418
   at System.Threading.ThreadHelper.ThreadStart_Context(Object state)
   at System.Threading.ExecutionContext.Run(ExecutionContext executionContext, ContextCallback callback, Object state)
   at System.Threading.ThreadHelper.ThreadStart()

Stack(s) at entering into critical section controlled by DeadlockMonitorTest.DeadlockMonitorTest+CustomLockObject=0x165F26B(Lock 69):
   at DeadlockMonitorTest.Program.ThreadMethodUsingRandomMonitors() in C:\DeadlockMonitorTest\Program.cs:line 418
   at System.Threading.ThreadHelper.ThreadStart_Context(Object state)
   at System.Threading.ExecutionContext.Run(ExecutionContext executionContext, ContextCallback callback, Object state)
   at System.Threading.ThreadHelper.ThreadStart()

Thread 12(Thread B) entered the critical sections in the following order:
    DeadlockMonitorTest.DeadlockMonitorTest+CustomLockObject=0xBB8560(Lock 88) ->
    DeadlockMonitorTest.DeadlockMonitorTest+CustomLockObject=0x165F26B(Lock 69) ->
    DeadlockMonitorTest.DeadlockMonitorTest+CustomLockObject=0x3E799B(Lock 62)

Stack(s) at entering into critical section controlled by DeadlockMonitorTest.DeadlockMonitorTest+CustomLockObject=0xBB8560(Lock 88):
   at DeadlockMonitorTest.Program.ThreadMethodUsingRandomMonitors() in C:\DeadlockMonitorTest\Program.cs:line 418
   at System.Threading.ThreadHelper.ThreadStart_Context(Object state)
   at System.Threading.ExecutionContext.Run(ExecutionContext executionContext, ContextCallback callback, Object state)
   at System.Threading.ThreadHelper.ThreadStart()

Stack(s) at entering into critical section controlled by DeadlockMonitorTest.DeadlockMonitorTest+CustomLockObject=0x165F26B(Lock 69):
   at DeadlockMonitorTest.Program.ThreadMethodUsingRandomMonitors() in C:\DeadlockMonitorTest\Program.cs:line 418
   at System.Threading.ThreadHelper.ThreadStart_Context(Object state)
   at System.Threading.ExecutionContext.Run(ExecutionContext executionContext, ContextCallback callback, Object state)
   at System.Threading.ThreadHelper.ThreadStart()

------ Afterburner Deadlock Prediction feature report for AppDomain=1[DeadlockMonitorTest.vshost.exe] end ------
The report is divided into sections – one per application domain (AppDomain) encountered in the test application. Each conflicting lock acquisition occurrence is described by stating which threads acquired locks in conflicting order, what was the order of acquisition for each thread and what were the call stacks at the moment of acquiring each of the locks in each of the sequences.
Here is an example of a Dispose Monitoring feature report:
------ Afterburner Dispose Monitoring feature report for AppDomain=1[DisposeMonitorTest.vshost.exe] start ------

Encountered undisposed DisposeMonitorTest.BaseGenericClass`2[System.Int32,System.String]=0x2B6A1CA constructed by Thread 10 at:
   at DisposeMonitorTest.DisposeMonitorTest.DoStuff() in C:\DisposeMonitorTest\DisposeMonitorTest.cs:line 25
   at DisposeMonitorTest.DisposeMonitorTest.Main(String[] args) in C:\DisposeMonitorTest\DisposeMonitorTest.cs:line 12
   at System.AppDomain._nExecuteAssembly(Assembly assembly, String[] args)
   at System.AppDomain.ExecuteAssembly(String assemblyFile, Evidence assemblySecurity, String[] args)
   at Microsoft.VisualStudio.HostingProcess.HostProc.RunUsersAssembly()
   at System.Threading.ThreadHelper.ThreadStart_Context(Object state)
   at System.Threading.ExecutionContext.Run(ExecutionContext executionContext, ContextCallback callback, Object state)
   at System.Threading.ThreadHelper.ThreadStart()

Encountered undisposed DisposeMonitorTest.DisposableClass=0x2B89EAA constructed by Thread 10 at:
   at DisposeMonitorTest.DisposeMonitorTest.DoStuff() in C:\DisposeMonitorTest\DisposeMonitorTest.cs:line 19
   at DisposeMonitorTest.DisposeMonitorTest.Main(String[] args) in C:\DisposeMonitorTest\DisposeMonitorTest.cs:line 12
   at System.AppDomain._nExecuteAssembly(Assembly assembly, String[] args)
   at System.AppDomain.ExecuteAssembly(String assemblyFile, Evidence assemblySecurity, String[] args)
   at Microsoft.VisualStudio.HostingProcess.HostProc.RunUsersAssembly()
   at System.Threading.ThreadHelper.ThreadStart_Context(Object state)
   at System.Threading.ExecutionContext.Run(ExecutionContext executionContext, ContextCallback callback, Object state)
   at System.Threading.ThreadHelper.ThreadStart()

------ Afterburner Dispose Monitoring feature report for AppDomain=1[DisposeMonitorTest.vshost.exe] end ------
This report is also divided into sections for each AppDomain encountered in the test application. Each instance of an object implementing IDisposable that was not disposed of before the application started to shut down is described by stating the object’s type, hash code and the call stack at the place of object allocation. Objects that survived until the application shut down are not reported based on the assumption that the application by design does not explicitly dispose of objects that are supposed to survive throughout the whole life span of the application execution.
Errors
There are some error conditions that can be reported either during the compilation post-processing step or during application test execution run. Here is the list of errors pertaining to the post-processing step that are reported in the build output window of Visual Studio:
- Possible error in nesting of Monitor Enter/Exit calls.
Most likely reason for this error is presence of a method with an unbalanced nesting of Enter() and Monitor.Exit() calls. The structure of your code is not necessarily erroneous but rather it does not follow the “standard” locking patterns and is something that might need more thorough examination to make sure that it does represent your intended lock acquisition/release logic. - Possible error in matching lock objects for Monitor Enter/Exit calls.
A method was encountered that seems to follow the standard locking patterns but different variables were used to enter and exit a particular critical section. Again, this does not necessarily imply an error but rather a situation that might require further scrutiny. - Various Internal failures.
An internal failure of Afterburner itself – most likely a bug. In such a case Afterburner’s compile time log file is updated with the details of the failure. The log file is named Afterburner.log and is located in Log subdirectory of Afterburner installation root folder. Some errors might generate additional log files with further error details. These files are also deposited into Log subdirectory. In case you do encounter such an internal error we ask that you please report it as per our Contact Us page. Please, describe the circumstances of the error in as many details as possible and attach all the log files found in Log subdirectory.
The following are Afterburner errors that can be reported during the runtime of the test application:
- “<thread id1> attempted to exit a critical section controlled by an unknown <object id1>”
A thread called Exit() using an object that was never used as a parameter for an Enter() call invoked earlier. - “<thread id1> attempted to exit a critical section controlled by <object id1>. <thread id2> is currently inside that critical section.”
A thread different from the one that acquired a lock is attempting to release it. - “<thread id1> attempted to exit a critical section by releasing <object id1>. It previously entered this critical section by locking <object id2>.”
After entering a critical section using an object, the thread is exiting the critical section using a different object. - “<thread id1> that never entered any critical sections is exiting a critical section controlled by <object id1>”
A thread that never called Enter() using any of the lock objects has called Exit() using some object. - Various internal runtime failures.
An internal failure of Afterburner runtime environment – in all likelihood a manifestation of an Afterburner bug. An error message is displayed on the application’s console if one is available or through a message box. A detailed description of the error is also logged into the Afterburner runtime log. The log is stored in Afterburner subdirectory created under the directory where the executable for your test application resides. This is the same directory that is used by Deadlock Prediction and Dispose Monitor features for their reports as described above. The log file is named Runtime.log. Yet again, in case you do encounter a runtime error we ask that you please report it as per our Contact Us page. Please, describe the circumstances of the error in as many details as possible and attach the Runtime.log file.
Current Limitations
- Only critical sections controlled by Monitor’s Enter() and Exit() methods are covered by Deadlock Detection and Deadlock Prediction
- Deadlock Detection and Deadlock Prediction features only operate within the boundaries of each individual application domain. Therefore, these features do not work with lock objects that can span multiple domains. Objects that fall into this category are internalized String objects, Type objects, etc.
- In order for Deadlock Prediction and Dispose Monitoring features to generate their reports the test application must exit in an orderly fashion rather than be killed or abruptly terminate due to an exception.
- Multi-module assemblies are not supported.
- Signed assemblies are not supported.
- Edit-and-continue is not supported.
- Target Framework feature of Visual Studio 2008 is not supported – the latest installed version of .NET is always used.
- Enabling any of the features introduces a dependency on Viade.Afterburner.Runtime.dll assembly for your test application. Either Afterburner must be installed on the test machine or this assembly must be registered in GAC or be otherwise available for the test application assembly search logic.
- Any computer on which you intend to run a test application with Deadlock Prediction and/or Dispose Monitor features enabled must have Afterburner installed in order for the generated raw report data to be post-processed and the text reports to be generated.
- While a test application for which Dispose Monitoring feature was enabled is being debugged, the debugger can break on an exception from ToString() method of a derived class if its base class implements IDisposable interface and Enable Just My Code Visual Studio debugger option is turned on. The call to ToString() is made by Afterburner code from within the constructor of the base class. If ToSTring() is overridden in the derived class (whose constructor has not been executed at this moment yet) and it refers to a member that is initialized in the constructor of the derived class, the method can throw an exception. This exception is harmless and Afterburner normally “eats” such exceptions, however, Enable Just My Code option causes debugger to break since the exception is being caught in non-user code. You can either ignore the break and continue, turn off Enable Just My Code option or place an explicit try/catch in the ToString() method of the derived class.
- Dispose Monitoring feature introduces the necessary tracking code into each class that explicitly implements IDisposable Undisposed instances of classes with derivation chains that include multiple base classes explicitly implementing IDisposable interface get reported more than once.
- Deadlock Prediction report can contain multiple reports of the same two threads acquiring the same two locks in conflicting orders. For example, thread A could have acquired lock #1 followed by #2 followed by #3 then released lock #3 and acquired lock #4 while thread B could have acquired lock #2 followed by #1. There could have been these two distinct moments in time
- thread A owns locks #1, #2 and #3; thread B owns locks #2 and #1
- thread A owns locks #1, #2 and #4; thread B owns locks #2 and #1
when locks #1 and #2 were held by different threads and were acquired in conflicting orders. A report is generated for each of these occurrences.
Uninstall
Even though we hope you will not need to use this functionality, uninstalling of the add-in can be done through the “Add or Remove Programs” application in the Control Panel by choosing “Afterburner” entry.